Het aandeel elektrisch vervoer in Amsterdam groeit sterk en zal de komende jaren blijven toenemen. Om die groei te faciliteren en de Amsterdamse ambities voor uitstootvrije mobiliteit in 2030 te bereiken, zijn voldoende laadpunten essentieel. De groei van laadpunten leidt tot extra druk op het energienetwerk, terwijl beschikbare netcapaciteit steeds schaarser wordt. Het is daarom belangrijk om een zo volledig mogelijk inzicht van de impact van private laadpunten op het elektriciteitsnet in kaart te brengen.
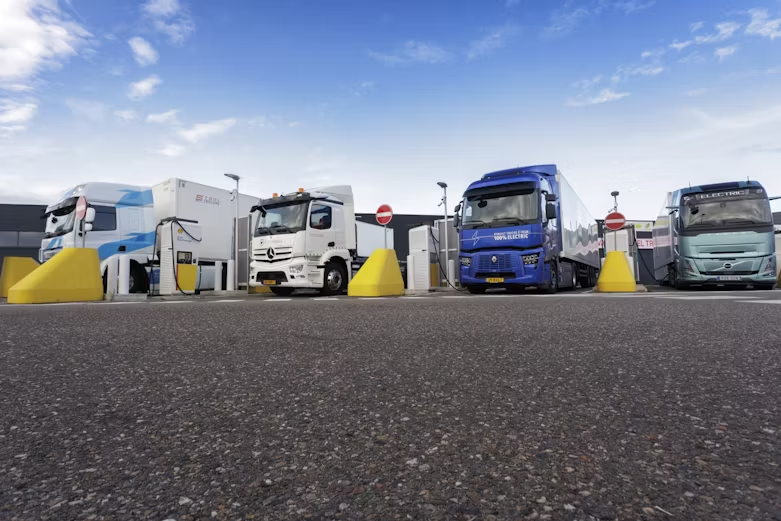
De meeste laadpunten worden op private grond, zoals in garages, bij kantoren en op bedrijventerreinen verwacht. Voor de groei van laadpunten bij bedrijven en publiek-toegankelijke gebouwen (zoals winkels, scholen en ziekenhuizen) heeft de gemeente Amsterdam een onderzoek uitgevoerd om de impact van de laadvraag op die locaties op het elektriciteitsnet in kaart te brengen. Laadpunten bij woningen zijn daarbij niet meegenomen. Ook is onderzocht waar slimme laadoplossingen ingezet kunnen worden om te voorkomen dat te veel auto’s op hetzelfde moment gaan laden. Tot slot zijn enkele mogelijke vervolgacties van de gemeente opgesteld om de toenemende piekvraag uit laden op private grond te verminderen.
Methode
Voor dit onderzoek is een aantal stappen doorlopen. Allereerst is gekeken waar buiten eigen woning om wordt geparkeerd. Op basis van een WOZ-database zijn private parkeerplaatsen (uitgezonderd bij woningen) ingedeeld in categorieën, zoals de categorie kantoor, winkels of industrie. Een locatiecategorie helpt om grofweg te bepalen wanneer en hoe lang mensen parkeren en met welk type voertuig (bestel-, vracht of personenauto).
Aan de hand van een parkeerprofiel is berekend wanneer mensen ongeveer laden (laadprofiel) en hoeveel vermogen de voertuigen laden (laadvraag). Het laadprofiel is weergegeven per 24 uur om het verloop van de laadvraag op een bepaalde locatie inzichtelijk te maken. Hierdoor is het mogelijk om te zien op welk moment van de dag de laadvraag groot of klein kan zijn. Door een combinatie van interviews, eerder gedane onderzoeken en expert-inschattingen is de laadvraag geëxtrapoleerd voor 2025 en 2030.
Om te achterhalen in hoeverre het elektriciteitsnet in de laadvraag kan voorzien, is de laadvraag ingedeeld in de verzorgingsgebieden van de 24 onderstations waar de bedrijven voor hun energievraag op zijn aangesloten.
Resultaten
Uit het onderzoek blijkt dat de gehele laadvraag in 2030 in Amsterdam voor een extra vermogenspiek van circa 100 megawatt (of 100.000 kilowatt) kan zorgen. Ter vergelijking, als het gemiddelde vermogen van een windturbine ongeveer 3 MW is, dan zouden er tegelijk 33 windturbines voor alleen de laadpalen maximaal moeten draaien om aan de piekvraag te voldoen.
Deze toename van laadvraag wordt in zo’n 1000 van de in totaal ongeveer 18.000 postcodegebieden verwacht. Dat is ongeveer 6% van het stadsoppervlak en daarmee zeer geografisch geconcentreerd.
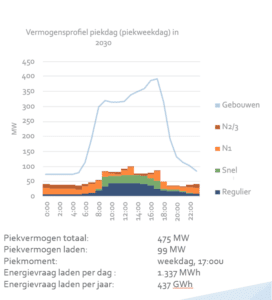
Figuur 1: Het vermogensprofiel gedurende een doordeweekse piekdag in 2030. `Regulier’ betekent de normale laadvraag van personenauto’s, `snel’ betekent de snellaadvraag van personenauto’s, `N1’ betekent busjes en `N2/3’ betekent vrachtverkeer. Daarachter staat het verbruiksprofiel van alle geïnventariseerde gebouwen.
Piekvraag verlagen
Om de hoogste piekvraag van de laadvraag te verlagen, is het effect van volgende oplossingen onderzocht:
- De laadvraag volledig spreiden over een dag (statische oplossing);
- De laadvraag binnen het restvermogen van de gebouwen inpassen;
- Locaties aanwijzen waarbij het grootste gedeelte binnen de uren van zonne-opwek valt;
- Locaties aanwijzen waar de pieklaadvraag dusdanig hoog is dat deze door middel van batterijen tijdelijk opgevangen kan worden.
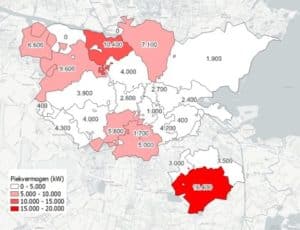
Figuur 2: Piekvraag privaat laden geaggregeerd naar 24 onderstations in Amsterdam (2030)
Uit de analyse blijkt dat er een zeer grote vraag uit een zeer klein aantal laders ontstaat. De snelladers (ong. 550) en de logistieke laders (ong. 1000) veroorzaken een veel grotere vraag dan de reguliere laders (ong. 14.000).
De totale piekvraag van het laden kan op onderstationsniveau aanzienlijk verlaagd worden (30-40%) door slimme laadtechnieken toe te passen, zoals static en/of dynamic load balancing. Bij dit soort technieken wordt bij grote belasting het laden van de auto verminderd of zelfs (even) gestopt en voorkom je daardoor een te hoge stroompiek.
Uit de analyse blijkt daarnaast dat bij een deel van alle locaties meer dan 33% van de laadvraag binnen een tijdsvenster van zonne-opwek valt. Deze locaties zijn bijzonder interessant voor investeringen in zonnepanelen. Vooral binnen de locatiecategorieën kantoor & onderwijs, distributie en hotels voldoen veel locaties aan dit criterium.
Ten slotte is berekend dat een deel van de locaties veel baat heeft bij investeringen in (stationaire) batterijen. Deze locaties kenmerken zich door relatief hoge, korte laadpieken, zoals snelladers bij winkels of depots. Een batterij zou die korte pieken kunnen opvangen. Ook dit moet nog verder gespecificeerd worden en vraagt om maatwerk per locatie.
Advies aan gemeente Amsterdam
De gemeente Amsterdam kan met haar beleid op meerdere manieren inspelen op de toenemende piekvraag. Voorbeelden van acties die de gemeente kan ondernemen zijn:
- Lobbyen op nieuwe type energie- of netcontracten om zo vermogen beschikbaar te stellen op de juiste momenten;
- In samenwerking met netbeheerders kan de gemeente een voortrekkersrol in pilots met innovatieve contractvormen en vraagbundeling van bedrijven innemen. Hiermee loopt de gemeente vooruit op nieuwe wetgeving rond contracten en regulering;
- Uitbreiding van voorlichting en advies aan bedrijven over slim laden, alternatieven voor verzwaring en (pilots met) alternatieve contractvormen via bestaande advieskanalen;
- Zelf het voortouw nemen om flex-oplossingen verder uit te werken en toegankelijk te maken voor bedrijven.
Meer informatie
Benieuwd naar het onderzoeksrapport? Vraag deze op via oplaadpunten@amsterdam.nl of via info@ev-consult.nl.